Power Usage Effectiveness (PUE) remains the industry-standard metric for measuring data centre energy efficiency. Defined as the ratio of total facility energy to IT equipment energy, a PUE of 2.0 means that for every watt consumed by IT equipment, another watt is consumed by cooling, lighting, power distribution and other facility systems. The global average PUE has hovered around 1.58 for several years, but leading facilities are achieving figures below 1.3 through precision control and continuous optimisation.
Why PUE Matters
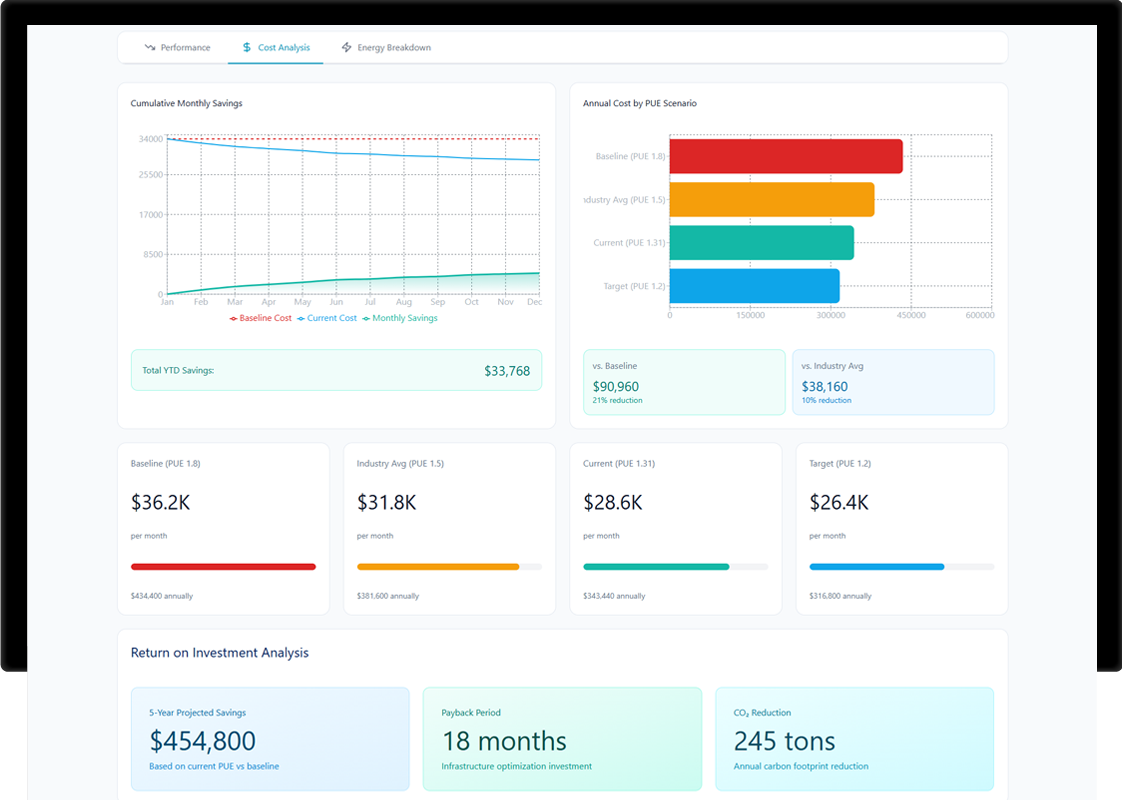
For data centre operators, even a small PUE improvement translates into significant cost savings. A facility consuming 2 MW of IT load at a PUE of 1.6 spends approximately $1.4 million per year on cooling and infrastructure energy alone (at $0.10/kWh). Reducing PUE from 1.6 to 1.35 saves over $350,000 annually from the same facility. Beyond cost, PUE improvement supports corporate sustainability targets, regulatory compliance and customer expectations around environmental responsibility.
The Role of Precision HVAC Control
Cooling typically accounts for 30-40% of total data centre energy consumption, making it the single largest opportunity for PUE improvement. Traditional approaches rely on fixed setpoints and constant-speed fans, resulting in overcooling and wasted energy. Modern precision control strategies are changing this.
Variable speed fan control is one of the most effective techniques. Modulating CRAH/CRAC fan speeds based on real-time thermal demand rather than running at constant speed delivers significant savings. Distech Controls ECLYPSE controllers can manage variable frequency drives (VFDs) on CRAH units, adjusting fan speed dynamically based on return air temperature and rack inlet conditions. Since fan power is proportional to the cube of speed, a 20% reduction in fan speed yields nearly 50% energy savings on that unit.
Chilled water valve optimisation is another key strategy. Rather than maintaining a fixed chilled water supply temperature, intelligent control sequences adjust valve positions based on actual cooling demand. During periods of low IT load or cooler ambient conditions, the chilled water plant can operate at higher supply temperatures, significantly reducing chiller energy consumption.
Hot aisle/cold aisle containment rounds out the approach. Physical containment combined with intelligent airflow management ensures that conditioned air reaches server inlets without mixing with hot exhaust air. Pressure sensors and variable speed controls maintain optimal differential pressure across containment boundaries.
Rack-Level Environmental Monitoring
Traditional data centre monitoring at the CRAH unit level provides only a coarse picture of environmental conditions. Hot spots, airflow imbalances and localised overcooling remain invisible until they cause equipment failures or trigger alarms. Rack-level monitoring changes this.
The SM5000 Multi-Sensor Data Acquisition Controller provides granular inlet and exhaust temperature monitoring at each rack position, along with humidity, airflow and power measurements. It enables hot spot detection by identifying racks where inlet temperatures exceed ASHRAE recommended limits before equipment is affected. It provides cooling efficiency mapping, showing how effectively conditioned air is being delivered to each rack. It supports capacity planning by helping operators understand available cooling capacity at each location for informed IT deployment decisions. And it enables stranded capacity recovery by identifying areas of overcooling where resources can be reallocated.
With SM5000 sensors deployed at scale (200+ units across a facility), operators gain a complete thermal map of their data centre in real time. This data feeds directly into closed-loop control strategies, enabling CRAH units to respond to actual conditions rather than worst-case assumptions.
Real-Time Energy Metering and PUE Calculation
Accurate, continuous PUE measurement requires energy metering at multiple points in the electrical distribution chain. Janitza UMG energy meters installed at main switchboards, mechanical distribution boards, PDU panels and UPS outputs provide the granular power data needed for real-time PUE calculation.
Key measurement points include total facility power at the main incoming supply, IT load power at PDU or UPS output, cooling plant power across chillers, CRAHs and pumps, and lighting and ancillary loads.
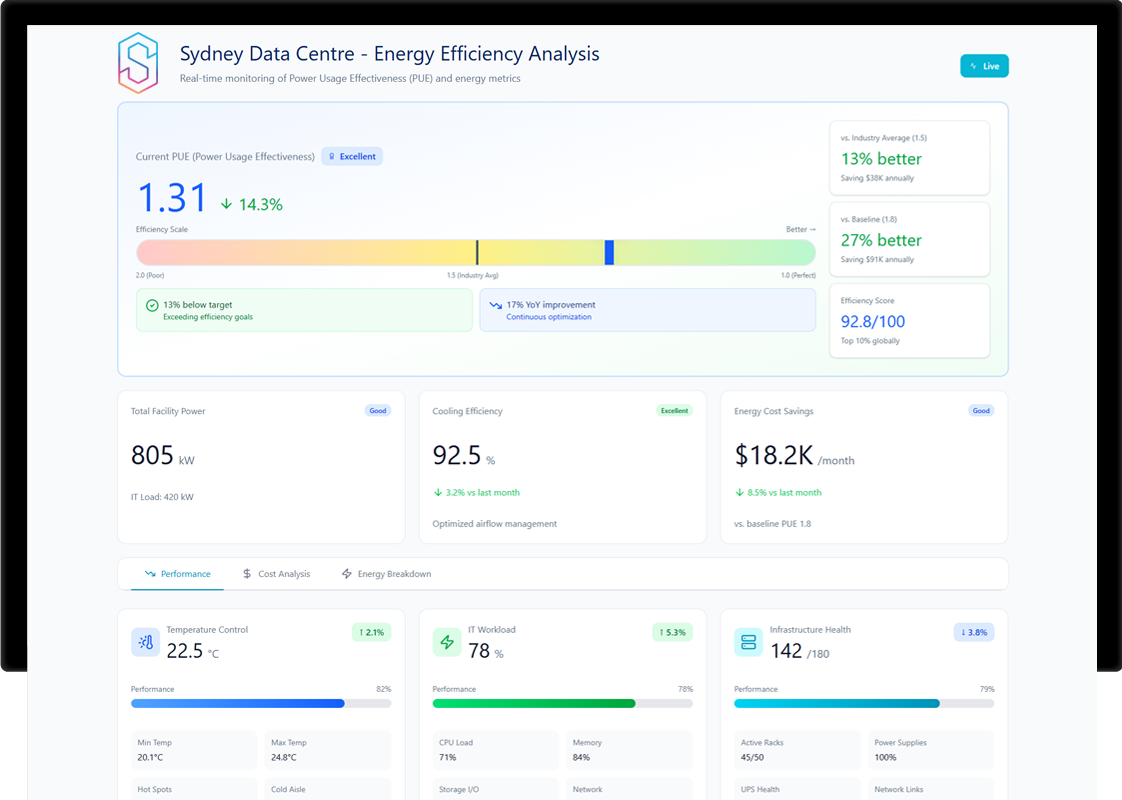
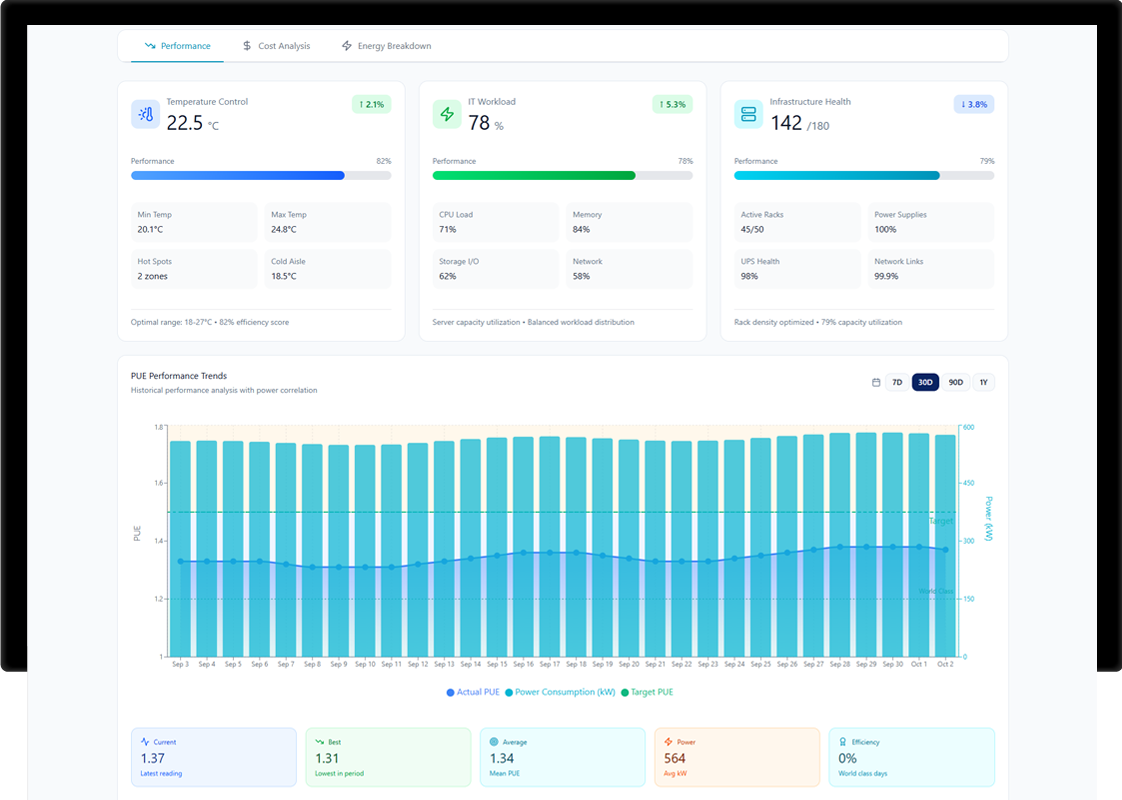
This data aggregates through the Sync DCiM Platform, which calculates PUE continuously and presents it on live dashboards alongside historical trends, benchmarks and automated alerts when PUE deviates from target ranges.
Putting It All Together
The most effective PUE optimisation programs combine all three elements: precision HVAC control via Distech ECLYPSE controllers, rack-level environmental monitoring via SM5000 sensors, and real-time energy metering via Janitza UMG meters. When these systems are integrated through a unified platform, operators can see exactly where energy is being consumed and where thermal conditions deviate from optimal. They can control cooling systems dynamically based on real-time demand rather than static setpoints. They can measure the impact of every change on PUE in real time. And they can optimise continuously through data-driven decision making.
This integrated approach is how Synchronous Building Automation has helped data centre clients achieve PUE improvements from 1.6 to 1.35, delivering measurable energy savings while supporting increased IT load density and maintaining environmental compliance.
Conclusion
PUE optimisation is not a one-time project. It is an ongoing process of measurement, analysis and refinement. The combination of modern HVAC controls, granular environmental sensing and real-time energy analytics provides the foundation for continuous improvement. For data centre operators seeking to reduce costs, meet sustainability targets and deliver the reliability their customers demand, investing in precision monitoring and control is one of the highest-return decisions available.
Platform Dashboard Examples